
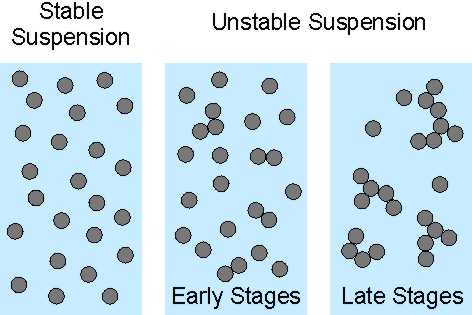
When colloidal particles are suspended in a liquid, the particle suspension can be stable or unstable. Particles in a stable suspension are dispersed individually. In an unstable suspension, particles aggregate. This means that particles stick to each other, first they form doublets, and later larger aggregates. When there are only small aggregates, one refers to early stages of the aggregation, while when large aggregates dominate, to late stages [1]. The situation is summarized in the right scheme below.
There are other mechanisms that may destabilize particle suspensions, and they include sedimentation, creaming, coalescence, or precipitation. These mechanisms may occur with aggregation simultaneously. Most frequent situation is that at later stages of the aggregation, the larger aggregates will also sediment. We will only deal with aggregation here, and will suppose that no other destabilization mechanisms infer with the aggregation process.
There are various techniques to characterize the formation of particle aggregates [1-3]. They include light scattering, turbidity measurements, microscopy, single particle counting, sedimentation, or rheology. All these techniques are used in a time-resolved fashion, meaning that one follows the evolution of the sample properties in time.
The present essay discusses how light scattering can be used to measure the growth of particle aggregates [2,4]. A light scattering experiment can be carried out in two different modes, namely as static and dynamic. A static light scattering (SLS) experiment monitors the light scattering intensity I as a function of the scattering angle θ, which is the angle between the direction from the sample towards the detector and the primary beam. Instead of using the scattering angle, one normally reports the magnitude of the scattering vector [1,5]
![]()
where n is the refractive index of the suspension and λ is the wavelength of the light in vacuum. In dynamic light scattering (DLS) one probes the fluctuations of the scattered light, and evaluates the dependence on time t of the intensity correlation function
![]()
where A and B are experimental constants and D is the diffusion coefficient of the particles, provided the suspension is sufficiently dilute. The diffusion coefficient is normally expressed in terms of the hydrodynamic radius R by means of the Stokes-Einstein relation [1,5]
![]()
where η is the viscosity of the solvent, T is the absolute temperature, and kB the Boltzmann constant.
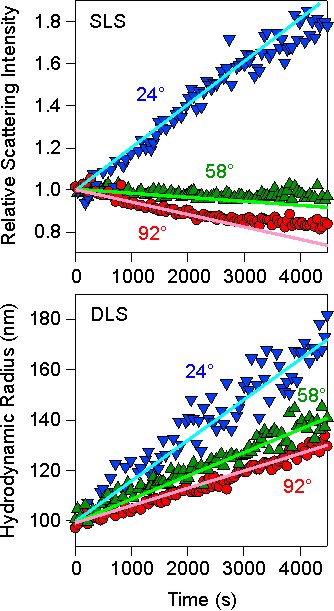
To monitor particle aggregation, one starts the experiment with an initially stable suspension, which is mixed with another solution that induces aggregation (i.e., coagulant). One then follows the time-evolution of the scattering intensity I(q,t) and the apparent hydrodynamic radius R(q,t), preferably at different angles, simultaneously. The measurement of each quantity requires some time, but 5–30 sec is normally sufficient to obtain a decent accuracy for both quantities. A typical plot of such time-evolution is shown in the left figure. The intensity has been normalized to the initial value. In this case, a concentrated, stable suspension of sulfate latex particles of 100 nm in radius was added to a solution of 1.0 M KCl solution, mixed, and monitored. The initial value of the hydrodynamic radius must correspond to the radius of a single particle in order to assure that one indeed probes the early stages.
 We focus on the early stages of the aggregation process, meaning on the formation of particle dimers according to the reaction
A + A → A2
When the particles are sufficiently large, this reaction is irreversible. The corresponding rate law reads
![]()
where k is the aggregation rate coefficient, and N1 and N2 are the number concentrations of the monomers and the dimers, respectively. Note that the rate coefficient in colloidal aggregation is defined to be a factor of 2 larger than in chemical kinetics. The rate at which the aggregation proceeds is characterized by the aggregation rate coefficient k, and one would thus like to be able to measure this quantity accurately.
The aggregation rate coefficient k can be extracted from the initial slopes of the time-resolved SLS or DLS signal in the following fashion. At early stages of the aggregation, the scattering intensity has only contributions from monomers and dimers
![]()
where I1(q) and I2(q) are the scattering intensities of a monomer and dimer, respectively. The initial rate of the change of the scattering intensity Σ can be evaluated from the time derivative of the above equation at short times, where the monomers dominate, by taking into account the conservation law N0 = N1 + 2 N2 where N0 is the total number concentration in the suspension. The result reads [2]
![]()
This apparent static rate Σ can be obtained from the initial slope of the scattering intensity versus time, as shown with straight lines in the above figure. This quantity depends on the scattering angle. As illustrated in the above figure, the intensity may also decrease, and lead to a negative apparent static rate.
The apparent hydrodynamic radius can be obtained from the average diffusion coefficient, which is given by the intensity weighted mean of the diffusion coefficients of the monomer D1 and of the dimer D2, namely
![]()
The apparent hydrodynamic radius is obtained from the Stokes-Einstein relation, and its initial rate of the change Δ can be again evaluated from the time derivative of the above equation at short times with the result [2]
![]()
where we introduced the hydrodynamic factor α = D1/D2 = 1.39. This factor represents the ratio between the diffusion coefficients the monomer and the dimer, and its numerical value follows from a calculation of the friction coefficient of a dimer under laminar flow conditions [1]. This apparent dynamic rate Δ can be obtained from the initial slope of the apparent hydrodynamic radius versus time, as shown in the above figure. Again, this quantity depends on the scattering angle. While higher order aggregates are forming, the apparent rates obtained from the initial slope provide information on the formation of the dimers only.
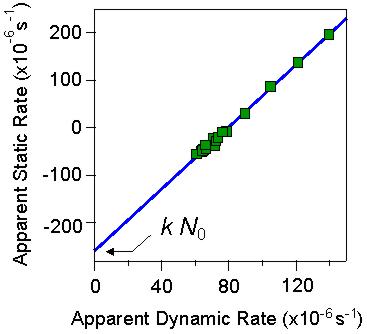
On modern light scattering instruments, one can measure the scattering intensity and hydrodynamic radius simultaneously and at different angles. One can therefore compare these quantities directly. Combing the above equations for Σ and Δ one finds
![]()
The plot of Σ versus Δ is a straight line. This plot is shown for the particles of 100 nm in radius in the figure on the right. Thereby, the intercept yields the aggregation rate coefficient, while the slope yields the hydrodynamic factor. From the data shown, one obtains an aggregation rate of 2.6 ×10⁻¹⁸ m3/s and a hydrodynamic factor of α = 1.44. The latter value is in good agreement with the theoretical value quoted above.
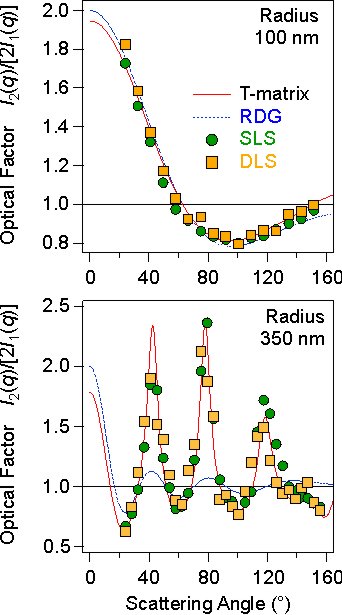
When the rate coefficient and the hydrodynamic factor are known, one can evaluate the optical factor I2(q)/[2I1(q)] from the SLS and DLS experiments. The optical factor is shown in the right figure below. One observes that this factor has a strong angular dependence and and may feature oscillations. The dotted line that passes through the data points gives the prediction of the Rayleigh-Gans-Debye (RGD) theory. This theory predicts that the optical factor is given by [5]
![]()
where R1 is the particle radius of the monomer. The top panel in the figure on the right shows that this prediction is excellent for the latex particles of 100 nm in radius. For particles of larger size and with higher refractive index, the RGD theory does no longer work. This situation is illustrated with similar latex particles with a radius of 350 nm in the lower panel of the figure. However, one can use a more precise computational scheme, the so-called T-matrix theory, and one can explain the observed angular dependence very well [6].
When one is able to estimate the optical properties of the dimers, one can also measure the absolute aggregation rate with a light scattering instrument that probes only one scattering angle. In this case, one must use either the RDG or the T-matrix theory to calculate the optical factor. RDG theory is fine for small particles and for small contrast. T-matrix theory can be used for larger spherical particles. Currently, we do not know how to reliably estimate the optical factor for non-spherical or strongly polydisperse particles.
When charged colloidal particles are suspended in simple electrolyte solutions of different concentrations, their aggregation rate shows a characteristic dependence. An example of such data for sulfate latex particles of 500 nm in radius suspended in KCl electrolyte is shown in the right figure below. At high salt concentration, the aggregation rate is large and constant. This region is referred to as the fast aggregation regime. At lower salt concentrations, the aggregation rate decreases with decreasing salt concentration. This region is referred to as the slow aggregation regime. The transition between the slow and fast regime is the critical coagulation concentration (CCC) as indicated in the figure.
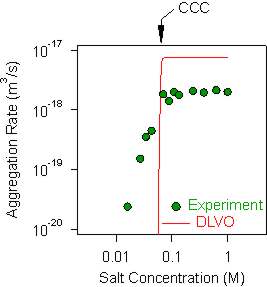 Derjaguin, Landau, Verwey, and Overbeek (DLVO) developed a theory that permits to predict the aggregation rates based on the solution composition, the surface charge density of the particles, and the Hamaker constant [4]. The experimental data are compared with such a DLVO prediction. One observes that the DLVO theory reflects the proper trend and is often capable to predict the CCC correctly. However, one typically finds two discrepancies. The first discrepancy is that the calculated aggregation rate coefficient in the fast regime is about a factor of 2-3 larger than the experimentally measured one. This deviation might be related to inaccuracies in the hydrodynamic resistance function that enters the DLVO calculation. The second discrepancy is related to the salt dependence in the slow regime. DLVO theory predicts the rate to be extremely sensitive to the salt concentration, while experimentally a less pronounced dependence is normally observed. This weaker dependence is probably related to the presence of surface charge heterogeneties or discreteness charge effects.
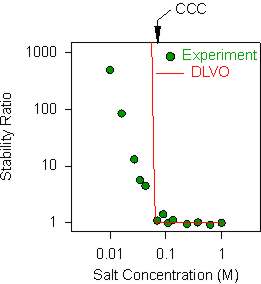
The aggregation rates are also frequently represented in terms of the stability ratio. This ratio is defined as
![]()
where kfast is the aggregation rate in the fast regime and k is the actual rate. Thus the stability ratio is unity in the fast regime, while it becomes larger in the slow regime as shown in the figure on the right. When experimental stability ratios are compared with DLVO theory, they obviously agree in the fast regime by definition. However, the discrepancies become visible in the slow regime. Note that other authors may use different definitions of the stability ratio.
The advantage of the stability ratio is that it can be measured directly by estimating the apparent rates from SLS or DLS with the relation
![]()
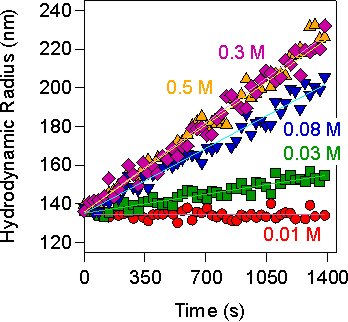 This approach is very useful in systems where the optical or the hydrodynamic factor cannot be easily estimated. In general, the apparent dynamic rates are simple to measure with DLS, and the initial radius provides a reliable test whether the sample was correctly dispersed at the beginning of the experiment. One then measures the apparent rate for different salt concentrations, and the stability ratio can be directly obtained from these measurements. An example is shown in the left figure. Aggregation of particles with a radius of 135 nm is induced with KCl, and one observes that the aggregation is fast at >0.3 M. Identifying the corresponding apparent rate in the fast regime, one can thus obtain the stability ratios directly. The advantage of this procedure is that one can determine stability ratios directly with a single-angle light scattering instrument.
Time-resolved light scattering represents a powerful tool to measure aggregation rate coefficients in colloidal dispersions. SLS as well as DLS can be used, even though DLS should be normally the method of choice, due to its better reproducibility, and the possibility to check the initial state of aggregation. The absolute rate coefficient can be obtained either by combining SLS and DLS, or by estimating the form factor and the hydrodynamic factor independently. Such estimates are rather straightforward, especially of smaller particles of low scattering power.
Gregor Trefalt, Istvan Szilagyi, and Michal Borkovec
Email. Gregor.Trefalt@unige.ch,
Istvan.Szilagyi@unige.ch,
Michal.Borkovec@unige.ch
Direct link www.colloid.ch/aggregation
First posted, September 29, 2013, last revision, August 28, 2014.
This work is licensed under a Creative Commons Attribution 4.0 International License.
[1] Russel W. B., Saville D. A., Schowalter W. R.: Colloidal Dispersions. Cambridge: Cambridge University Press; 1989.
[2] Holthoff H., Schmitt A., Fernandez-Barbero A., Borkovec M., Cabrerizo-Vilchez M. A., Schurtenberger P., Hidalgo-Alvarez R. (1997) Measurement of absolute coagulation rate constants for colloidal particles: Comparison of single and multiparticle light scattering techniques, J. Colloid Interface Sci., 192, 463-470. Link to publisher.
[3] Xu S. H., Sun Z. W. (2011) Progress in coagulation rate measurements of colloidal dispersions, Soft Matter, 7, 11298-11308. 10.1039/C1SM06237A.
[4] Kobayashi M., Skarba M., Galletto P., Cakara D., Borkovec M. (2005) Effects of heat treatment on the aggregation and charging of Stöber-type silica, J. Colloid Interf. Sci. 292, 139-147, 10.1016/j.jcis.2005.05.093.
[5] Berne B. J., Pecora R.: Dynamic Light Scattering. Malabar: Robert E. Krieger Publishing; 1990.
[6] Holthoff H., Borkovec M., Schurtenberger P. (1997) Determination of light-scattering form factors of latex particle dimers with simultaneous static and dynamic light scattering in an aggregating suspension, Phys. Rev. E, 56, 6945-6953. 10.1103/PhysRevE.56.6945.